Table of Contents
The Energy Crisis: A Summary for Meteorologists
Presented on April 15, 2008. Here is the abstract.
Dedication to Friedrich Hayek
The seminar was dedicated to Friedrich Hayek. With Lester Brown's “Plan B” advocacy for wartime mobilization of the energy industry, which you can read about in this review by TIME, we ignore Hayek's warning at our peril. By the way, the TIME article misrepresents what the mobilization would produce. Lester Brown's Table 12-1 has a goal for 3,000,000 megawatts of wind power capacity in 2020. For wind power, actual production is typically 1/3 of capacity. Confusing capacity with production is common in presentations about wind power. Let's hope the planners catch the mistake before the wartime mobilization proceeds, or perhaps we could be in for a repeat of Ethanol and Other Biofuels: A Global Warming Solution Worse Than the Problem.
Limits to Growth
- A classic study on The Limits to Growth.
- The 1972 prediction for a food crisis to be unfolding in 2008 was accurate. It was obvious to OU students in February 2008: Students facing rising foodprices, a nationwided trend.
- Things had become worse by April 14, 2008 (the day before my first seminar): Riots, instability spread as food prices skyrocket
- And then on the morning of my seminar: Fuel Choices, Food Crises and Finger-Pointing
- And then a few days later: Across Globe, Empty Bellies Bring Rising Anger
Peak Oil
- This page has a striking plot of oil production history, and a prognosis: OIL AND GAS LIQUIDS 2004 Scenario
- The above 2004 prognosis for flat production through 2008 seems to have come true: Oil Price Rise Fails to Open Tap
- 6 bbl of oil is approximately 1 cubic meter
- 30 Gb of oil is 5 giga cubic meters
- or 5 cubic kilometers, or one cubic mile .
- that is one cubic mile of oil every year, transported, refined, combusted, etc.
- total human energy consumption is equivalent to 3 cubic miles per year, mostly fossil fuels
- Americans consume the energy equivalent of 8 tons of oil per year or 8 cubic meters
- 11.4 Gb of oil has been extracted from Prudhoe bay in Alaska, which was once in the top 20 of world oil fields. Exhaustion is expected at 12.3 Gb, or 0.44 cubic miles, or 53 days of world energy consumption. Will Alaska rise again? Probably not.
- Prudhoe Bay was the bulk of the North Slope oil. Here is the history and forecast for the entire North Slope: see Oil and Alaska; The ANWR Controversy and Alaska North Slope Oil and Gas Resources Assessment
- Saudi Arabia has 240 Gb of oil, or 8.5 cubic miles.
- It’s no secret anymore that for every nine barrels of oil we consume, we are only discovering one. -The BP Statistical Review of World Energy, March 13th, 2008
- Learn more in the Wikipedia: World energy resources and consumption and Peak Oil.
Watts
- 1 terawatt = 1 TW = 1012 W is convenient unit for measuring world energy consumption.
- World energy consumption was 15 TW in 2004. With a global population of 6.5 x 10⁹, per capita consumption was 2300 W.
- Per capita consumption in America was 11,400 W.
- Humans eat about 100 W of food. (Note the fundamental problem in converting food to fuel).
- With 100 W of food, humans can sustain about 10 W of muscle work, averaged over a day.
- 1 gigawatt = 1 GW = 109 W , electrical production from a large nuclear power plant.
- 1 megawatt = 1 MW = 106 W, electrical production from a very large, modern wind turbine
Shell energy scenarios to 2050
- Shell (the “Oil” company) offers future scenarios for global energy supply within the PDF document
Shell energy scenarios to 2050, available at the Shell.com site
Scramble Scenario
Scramble reflects the dynamics behind energy security. Immediate pressures drive decision-makers, especially the need to secure energy supply in the near future for themselves and their allies. National government attention naturally falls on the supply-side levers readily to hand, including the negotiation of bilateral agreements and incentives for local resource development. Growth in coal and biofuels becomes particularly significant. Despite increasing rhetoric, action to address climate change and encourage energy efficiency is pushed into the future, leading to largely sequential attention to supply, demand and climate stresses…

Blueprint Scenario
As more consumers and investors realise that change is not necessarily painful but can also be attractive, the fear of change is moderated and ever-more substantial actions become politically possible. These actions, including taxes and incentives in relation to energy and CO2 emissions, are taken early on. The result is that although the world of Blueprints has its share of profound transitions and political turbulence, global economic activity remains vigorous and shifts significantly towards a less energy-intensive path.

Summary of the Shell Scenarios
- In 2050, coal consumption is 2 to 2.5 as large as in 2000. In Blueprints, some of the CO2 is sequestered. Scramble is on a path to increase carbon dioxide
well above550ppmv. In Blueprint, a long-term path below 550 ppmv is feasible. - Biomass contains non-commercial biomass, for example 3rd world wood cooking fires. Commercial biomass may replace some of that, for example for aviation fuels. But Blueprints contains much less biomass than Scramble. International agreements prevent the deforestation required for increasing biofuel production.
- There is more nuclear energy and oil in Blueprint, arising from the fact that the world is more ordered.
- Both scenarios have a mysterious large other. These plots were drafted from the data in the appendix Summary quantification. Other denotes Other Renewables. This may be a mistake in the appendix. There are no explicitly defined Other Renewables forecasted - in this report or elsewhere - to produce more power than wind in 2050.
The Coal Dilemma
- It is doubtful that the Australian PM could do that, given Europe Turns Back to Coal, Raising Climate Fears or China's coal investment or China’s Green Energy Gap . China built 114,000 megawatts of fossil-fuel-based generating capacity last year. That is .114 TWe, which could consume about .3 TW of coal!
- Or given that MIT's Emanuel Rethinking Warming/Hurricanes
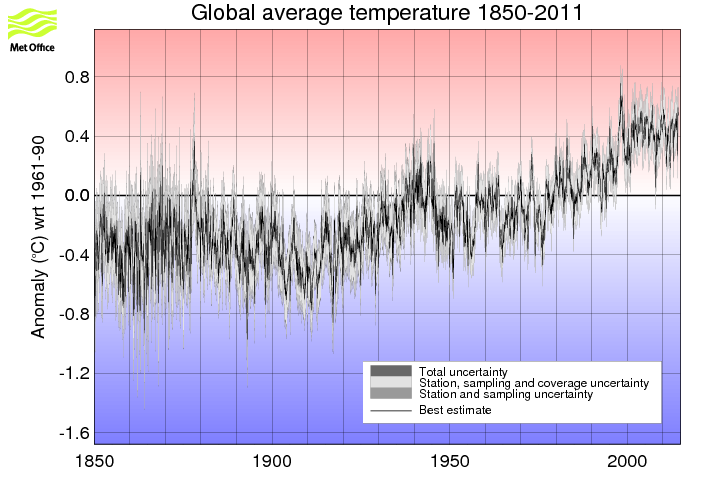
- Or evidence for global cooling. Here is the monthly global temperature from the Hadley Center . Also see the leveling off of methane concentration , which may indicate less melting of permafrost, etc.
- Is it really possible for a group of politicians to slay the coal industry? What would be the political consequences? William Shakespeare's Julius Caesar might be relevant. You are invited you to watch Marlon Brando as Marc Antony (think
Julius Carbon). - And on May 30, 2008: Mounting Costs Slow the Push for Clean Coal
- Here is an example of capital investment in coal: 1.5 billion euros for a 800 MW plant or \$2.71 per Watt. The costs of fuel for the plant will be comparable to the interest being paid on the capital. Here is a comparison of capital and operating costs in 2005. You can work out the 2007 costs of fuel from the graph at bottom of this 2007 story. Apparently in 2005, the costs for coal are a bit lower than my estimate of a wholesale cost of \$0.023 per kWh to pay off capital investment on the power plant (from the RWE story above), and \$0.022 per KWh for coal, for that modern 46% efficient plant. In 2008, Oklahoma Gas and Electric sells electricity to my home for \$0.10 per KWh.
Biofuels
- 0.017 TW from ethanol in USA in 2007, using 20% of USA corn crop. 0.44 W per square meter. The Energy Independence and Security Act of 2007 requires 0.1 TW of biofuel production by 2022. (Compare with the annual increase in China's coal consumption for electrical generation).
- Ideally, biofuels were supposed to be carbon neutral
- Thus, in 2005 we still see advocacy that The use of biofuels to replace conventional fuels in transport can help reduce greenhouse gas emissions
- According to DOE's Ethanol Myths and Facts , so much fossil fuel is burned to produce ethanol from corn that it has a carbon footprint of 81% of simply using gasoline directly, and skipping the ethanol production!
- In 2008 we learn it could be even worse than that: Biofuels Deemed a Greenhouse Threat
- Vice President Al Gore saved biofuels.
- Lester Brown slams production of ethanol from food crops: Why Ethanol Production Will Drive World Food Prices Even Higher in 2008
- A historical precedent: Bush biofuel plan similar to Mao's "Great Leap Forward"
- On June 6, 2008: Bioenergy: Fuelling the food crisis?
- In November, 2010 Al Gore reverses his view on ethanol.
Nuclear Power
- A new 1.6 GW nuclear power plant: World's most powerful nuclear power plant under construction at Olkiluoto. The construction cost will be about 5 billion US dollars, or about \$3.12 per Watt, as inferred from Nuclear Bid to Rival Coal Chilled by Flaws, Delay in Finland
- New nuclear construction planned for the United States: NRG Energy Submits Application for New 2,700 Megawatt Nuclear Plant in South Texas ; First nuclear plant license application in 29 year (in US).
- Europe is reconsidering its anti-nuclear stance: Italy Plans to Resume Building Atomic Plants .
- Here is an optimistic forecast for World uranium reserves , and a pessimistic forecast: peak uranium.
From the Wikipedia's Nuclear Power we obtain:

Many of current nuclear power plants are old and are scheduled to be decomissioned. So despite quotes from industry spokeman like 100-300 reactors will be built around the world by 2030 , there is no significant increase in global nuclear power to year 2030. Flat production is also seen in the Shell scenarios, but with a slight nuclear revival to begin in about 2030.
Hydroelectric power
- Three Gorges Dam will produce 16 GW. With the official cost stated to be \$25 billion US, that is \$1.56 per Watt.
- Modest expansion is projected for hydroelectric power, mostly in China, and very little in North America. See the wikipedia: Hydroelectricity
Photovoltaic power
- We can learn much from the Wikipedia's Photovoltaics and Solar Cell. Here is monitor of cost per peak Watt, showing for May, 2008 \4.81 per Watt. But using 20% capacity factor, typical for Southern California, puts the cost at \$24 per Watt. Nevertheless, there are some optimistic projections of \$2.50 per Watt peak. Here is optimistic story about start-ups exploring exotic materials like copper indium gallium selenide, or CIGS, an alternative to the conventional crystalline silicon that is now the dominant technology. Unfortunately, exotic means rare: gallium and indium will probably contribute to less than 1 per cent of all future solar cells - a limitation imposed purely by a lack of raw material .
Concentrating solar power
- Abengoa Solar To Build World's Largest Solar Plant . The claim is 240 MW peak capacity. The
70,000 homesimplies about 140 MW production. A revenue of \$4 billion over 30 years implies \$133 million per year. If the yearly revenue is a 7.5% return on the investment, then the investment was \$1777 million. \$12.70 per Watt. More than three times the cost of nuclear power?
Wind power
- Cape Wind is expected to produce 170 MW with an investment of \$900 million. \$5.29 per Watt. Consistent with the common statement that wind energy is cheaper than solar.

Investment Needed
- UN: Climate Change May Cost \$20 Trillion . So for 20 TeraDollars do we get 4 TeraWatts of renewable (or low carbon) energy? Or 2
TeraWatts? How many TeraWatts do we need to place the world on a markedly different and sustainable energy trajectory ?
- Today, the global energy industry spends about \$300 billion a year in new plants, transmission networks and other new investment, according to U.N. figures. So that implies additional spending of approximately \$700 billion per year. That is a lot of money, given that World military spending is \$1.1 trillion. But maybe it is a bargain, considering that people around the world spend a staggering \$290 billion a year on over-the-counter beauty products.
Renewable Energy Options
Need a review here of flux density physics, and costs of:
- land-based photosynthesis: 1 Watt per square meter (And that is only energy out, not subtracting off the energy required to produce biofuels from photosynthesis).
- wind-energy: 3 Watts per square meter (If your wind turbines are too densely spaced, the wind will diminish to enforce that limit, and waste the turbine capacity).
- photovoltaics: 20 Watts per square meter. (Presently, too costly. Especially for the greater than 10% efficiency.)
I overprinted on this image from the Wikipedia to make the following images. The depicted sites for photovoltaic land use are optimal; the depicted sites for wind farms and photosynthesis are not (of course).
required photovoltaic land use

required wind farm land use
This land could be dual use, the turbines must be spread out. The flux density removed by the disc of the blades of the turbine could be order 100 times this number.

required photosynthesis land use
This is not biofuels. No account is made here for the energy inputs for
growing, harvesting, and processing the output from photosynthesis.
